👇 SITEWIDE 50% OFF, REGISTER NOW👇
00
HOURS
00
MINUTES
00
SECONDS
USE COUPON
MONDAY50
Coupon copied!
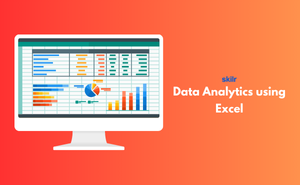
Excel for Data Analytics is a way of turning raw information into meaningful insights using one of the most popular software tools. With Excel, you can manage large datasets, clean them, and use functions like pivot tables, conditional formatting, and charts to understand the story behind the numbers. It allows users to explore trends, monitor progress, and generate professional reports with ease.
Think of it as a smart toolkit for data-driven decisions. Instead of struggling with endless spreadsheets, Excel simplifies analysis by offering ready-to-use formulas and visualization options. This makes it valuable for anyone who wants to save time, reduce errors, and make informed choices based on data.
This exam is ideal for:
Credentials that reinforce your career growth and employability.
Start learning immediately with digital materials, no delays.
Practice until you're fully confident, at no additional charge.
Study anytime, anywhere, on laptop, tablet, or smartphone.
Courses and practice exams developed by qualified professionals.
Support available round the clock whenever you need help.
Easy-to-follow content with practice exams and assessments.
Join a global community of professionals advancing their skills.
(Based on 201 reviews)
Very practical and easy to follow. I appreciate the team for offering such great Excel training for free.
This course helped me refresh important Excel skills. Thanks to the team for making data analytics approachable.
Basic familiarity helps, but beginners can also learn step by step.
It’s the process of analyzing, summarizing, and visualizing data using Excel’s built-in tools.
Data cleaning, summarization, visualization, and business reporting skills.
Yes, visualization and dashboard building are part of the course.
No, Excel is beginner-friendly and requires no coding.
Yes, though very large datasets may need advanced tools like SQL or Python.
Absolutely, Excel is widely used in startups and SMEs for daily decision-making.
Finance, marketing, operations, HR, healthcare, and more.
Yes, it’s a great starting point, and many businesses still rely heavily on Excel.
Students, professionals, or anyone looking to improve their data analysis skills.

